Interacting with APIs: Example with Spoonacular Food and Recipe API
Rina Deka 06/25/2023
This document is a vignette to demonstrate how one may retrieve data from an API. In this tutorial, I will be interacting with Spoonacular’s food API. I have created a few functions to interact with a few endpoints for user ease, and I’ll use these to explore some of the data that was retrieved.
Requirements
To use the functions for interacting with the food API, I used the following packages:
httr: This is a package that contains useful tools for Working with URLs and HTTP, organised by HTTP verbs (such as GET() and POST()). We use this for the URL call GET() as indicated in the spoonacular documentation.jsonlite: API interactiontidyverse: A package which is in and of itself a set of packages that help you manipulate and visualize data.
Please note that the API key I used was “987c314948d14831ac64f7edaa24a25c”, but yours will be different.
myKey = "987c314948d14831ac64f7edaa24a25c"
API Interaction Functions
This is where I created functions for interacting with spoonacular’s complex search AP, which is itself a combination of searching by query, ingredients, and by nutrients into a single endpoint. I also created functions for interacting with spoonacular’s Glycemic Load calculator for ingredients. This way, you can parse through recipe data based on certain conditions (such as a dietary restriction), look at the nutritional information, and then also try to find grocery products that might suit your recipe.
getRecipesByDiet
Suppose that I would like to create a function that will return well-parsed data so that one can look at the corresponding ingredient and nutrition information for a recipe given some sort of dietary restriction. The function below allows the user to get pertinent information about recipes with the dietary restriction in question.
A full list of supported diets is available here.
Spoonacular defines the diets as such: > Diet Definitions Every API endpoint asking for an diet parameter can be fed with any of these diets. Gluten Free: Eliminating gluten means avoiding wheat, barley, rye, and other gluten-containing grains and foods made from them (or that may have been cross contaminated). Ketogenic: The keto diet is based more on the ratio of fat, protein, and carbs in the diet rather than specific ingredients. Generally speaking, high fat, protein-rich foods are acceptable and high carbohydrate foods are not. The formula we use is 55-80% fat content, 15-35% protein content, and under 10% of carbohydrates. Vegetarian: No ingredients may contain meat or meat by-products, such as bones or gelatin. Lacto-Vegetarian: All ingredients must be vegetarian and none of the ingredients can be or contain egg. Ovo-Vegetarian: All ingredients must be vegetarian and none of the ingredients can be or contain dairy. Vegan: No ingredients may contain meat or meat by-products, such as bones or gelatin, nor may they contain eggs, dairy, or honey. Pescetarian: Everything is allowed except meat and meat by-products - some pescetarians eat eggs and dairy, some do not. Paleo: Allowed ingredients include meat (especially grass fed), fish, eggs, vegetables, some oils (e.g. coconut and olive oil), and in smaller quantities, fruit, nuts, and sweet potatoes. We also allow honey and maple syrup (popular in Paleo desserts, but strict Paleo followers may disagree). Ingredients not allowed include legumes (e.g. beans and lentils), grains, dairy, refined sugar, and processed foods. Primal: Very similar to Paleo, except dairy is allowed - think raw and full fat milk, butter, ghee, etc.
Thus, the valid options for the “diet” argument include any of the above in a string. Note that strings such as “paleolithic” work for “paleo, and so on. Note that vegetarian implies lacto-ovo vegetarian.
getRecipesByDiet <- function(diet,number=10,apiKey="987c314948d14831ac64f7edaa24a25c") {
  #note: this function defaults to my API key, but you should use your own in the function argument
  endpoint <- "/recipes/complexSearch"

  # Set the parameters for the API request
  parameters <- list(
    apiKey = apiKey,
    number = number,  # Number of recipes to retrieve (default: 10)
    diet = diet,  # Dietary restriction (e.g., "vegan", "gluten-free", "keto")
    addRecipeNutrition = TRUE  # Include additional recipe information
    # You can add more parameters as required by the endpoint
  )

  # Build the URL
  base_url <- "https://api.spoonacular.com"
  url <- paste0(base_url, endpoint)

  # Send the API request
  response <- GET(url, query = parameters)

  # Check for successful response
  if (http_type(response) == "application/json") {
    content <- fromJSON(rawToChar(response$content), flatten = TRUE)

    # Extract relevant information from the response
    recipes <- content$results

    #store in a dataframe
    recipes <- as.data.frame(recipes)

    #removing the redundant columns
    recipes <- recipes %>% select(-c("gaps", "creditsText", "sourceName", "sourceUrl" ,"image","imageType","summary","analyzedInstructions","spoonacularSourceUrl","license","nutrition.properties","nutrition.flavonoids"))

    ###resetting the ingredients dataframe in the dataframe, so we can pivot wider

    #Rename "id" column in nutrition.ingredients to "ingredient_id"
    recipes$nutrition.ingredients <- lapply(recipes$nutrition.ingredients, function(x) {
      colnames(x) <- c("ingredient_id", names(x)[-1])
      x
    })

    #Rename "name" column in nutrition.ingredients to "ingredient_name"
     recipes$nutrition.ingredients <- lapply(recipes$nutrition.ingredients, function(x) {
      colnames(x)[colnames(x) == "name"] <- "ingredient_name"
      x
    })

    #Rename the "amount" column in nutrition.ingredients to "ingredient_amount"
     recipes$nutrition.ingredients <- lapply(recipes$nutrition.ingredients, function(x) {
      colnames(x)[colnames(x) == "amount"] <- "ingredient_amount"
      x
    })

    #Rename the "unit" column in nutrition.ingredients to "ingredient_unit"
     recipes$nutrition.ingredients <- lapply(recipes$nutrition.ingredients, function(x) {
      colnames(x)[colnames(x) == "unit"] <- "ingredient_unit"
      x
    })

     #Rename the "unit" column in nutrition.ingredients to "ingredient_unit"
     recipes$nutrition.ingredients <- lapply(recipes$nutrition.ingredients, function(x) {
      colnames(x)[colnames(x) == "nutrients"] <- "ingredient_nutrient"
      x
    })

   #unnest the ingredients column to wider
   recipes<- unnest_wider(recipes, nutrition.ingredients)

   ###resetting the nutrients dataframe in the dataframe, so we can pivot wider

    #Rename "name" column in nutrition.nutrients to "nutrient"
     recipes$nutrition.nutrients <- lapply(recipes$nutrition.nutrients, function(x) {
      colnames(x)[colnames(x) == "name"] <- "nutrition_info"
      x
    })

      #Rename "amount" column in nutrition.nutrients to "nutrient_amount"
     recipes$nutrition.nutrients <- lapply(recipes$nutrition.nutrients, function(x) {
      colnames(x)[colnames(x) == "amount"] <- "nutrient_amount"
      x
    })

  #Rename "unit" column in nutrition.nutrients to "nutrient_unit"
     recipes$nutrition.nutrients <- lapply(recipes$nutrition.nutrients, function(x) {
      colnames(x)[colnames(x) == "unit"] <- "nutrient_unit"
      x
    })


   #unnest the ingredients column to wider
   recipes<- unnest_wider(recipes, nutrition.nutrients)


    return(recipes)
  } else {
    stop("API request failed. Status code: ", status_code(response))
  }
}
getIngredientsByQuery
This function gets ingredient information for a given query. Suppose we would like to utilize macro-nutrient information for when we go shopping for our recipes, after we’ve made a judgement call on what restrictions we’d like to put in based on the available recipes given by the previous function.
I’ve created the function below to allow a user to filter grocery products based off of ingredient information, and specifically filter by macro-nutrients and dietary intolerance(/s). We’ll be using this as a demonstration of the limits of APIs at the end.
getIngredientsByQuery <- function(apiKey, query, carbs, fats, protein, intolerances) {
  # Prepare the query parameters
  query_params <- list(
    apiKey = apiKey,
    query = query,
    minCarbs = carbs,
    minFats = fats,
    minProtein = protein,
    intolerances = paste(intolerances, collapse = ",")
  )

  # Construct the API URL
  base_url <- "https://api.spoonacular.com/food/ingredients/search"
  api_url <- modify_url(base_url, query = query_params)

  # Make the API request
  response <- GET(api_url)

  # Check if the request was successful
  if (http_status(response)$category != "Success") {
    stop("API request failed: ", http_status(response)$reason)
  }

  # Parse the response JSON
  response_json <- content(response, "text", encoding = "UTF-8")
  ingredients <- fromJSON(response_json)

  # Check if there are no results
  if (ingredients$totalResults == 0) {
    message("No ingredients found for the given query and criteria.")
    return(NULL)
  }


  #return(ingredient_data)
  return(ingredients$results)
}
Here’s an example showing how a user can utilize the function above.
# Example usage
apiKey <- "987c314948d14831ac64f7edaa24a25c"
query <- "pasta"
carbs <- 10
fats <- 5
protein <- 20
intolerances <- c("vegetarian")

ingredient_df <- getIngredientsByQuery(apiKey, query, carbs, fats, protein, intolerances)

print(ingredient_df)
##          id               name            image
## 1     20420              pasta      fusilli.jpg
## 2  10118334        pasta dough        dough.jpg
## 3  11020420       pasta shells  shell-pasta.jpg
## 4     99036    pasta salad mix      fusilli.jpg
## 5  10520420 jumbo pasta shells jumbo-shells.jpg
## 6  10920420               orzo         orzo.jpg
## 7  11520420               ziti         ziti.jpg
## 8     20499        short pasta        elbow.jpg
## 9     20093        fresh pasta      fusilli.jpg
## 10 11320420    corkscrew pasta      fusilli.jpg
Exploratory Data Analysis
Suppose that I wanted to check how healthy the diets of two patients are: one who is a vegan and another who is ketogenic. Let’s produce the data frames for both of them. The data will come from 100 recipes.
vegan_df <- getRecipesByDiet("vegan",number=100,apiKey="987c314948d14831ac64f7edaa24a25c") %>% unnest("cuisines",keep_empty=TRUE) %>%
  unnest("dishTypes",keep_empty=TRUE) %>%
  unnest("diets",keep_empty=TRUE) %>%
  unnest("occasions",keep_empty=TRUE) %>% group_by()
head(vegan_df)
## # A tibble: 6 × 38
##   vegetarian vegan glutenFree dairyFree veryHealthy cheap veryPopular sustainable lowFodmap weightWatcherSmartPoints
##   <lgl>      <lgl> <lgl>      <lgl>     <lgl>       <lgl> <lgl>       <lgl>       <lgl>                        <int>
## 1 TRUE       TRUE  TRUE       TRUE      TRUE        FALSE FALSE       FALSE       FALSE                           12
## 2 TRUE       TRUE  TRUE       TRUE      TRUE        FALSE FALSE       FALSE       FALSE                           12
## 3 TRUE       TRUE  TRUE       TRUE      TRUE        FALSE FALSE       FALSE       FALSE                           12
## 4 TRUE       TRUE  TRUE       TRUE      TRUE        FALSE FALSE       FALSE       FALSE                           12
## 5 TRUE       TRUE  TRUE       TRUE      TRUE        FALSE FALSE       FALSE       FALSE                           12
## 6 TRUE       TRUE  TRUE       TRUE      TRUE        FALSE FALSE       FALSE       FALSE                           12
## # ℹ 28 more variables: preparationMinutes <int>, cookingMinutes <int>, aggregateLikes <int>, healthScore <int>,
## #   pricePerServing <dbl>, id <int>, title <chr>, readyInMinutes <int>, servings <int>, cuisines <chr>,
## #   dishTypes <chr>, diets <chr>, occasions <chr>, author <chr>, nutrition_info <list<chr>>,
## #   nutrient_amount <list<dbl>>, nutrient_unit <list<chr>>, percentOfDailyNeeds <list<dbl>>,
## #   ingredient_id <list<int>>, ingredient_name <list<chr>>, ingredient_amount <list<dbl>>,
## #   ingredient_unit <list<chr>>, ingredient_nutrient <list<list>>, nutrition.caloricBreakdown.percentProtein <dbl>,
## #   nutrition.caloricBreakdown.percentFat <dbl>, nutrition.caloricBreakdown.percentCarbs <dbl>, …
Similarly, for 100 recipes, let’s look at the data for someone who is on a keto diet.
keto_df <- getRecipesByDiet("keto",number=100,apiKey="987c314948d14831ac64f7edaa24a25c") %>% unnest("cuisines",keep_empty=TRUE) %>%
  unnest("dishTypes",keep_empty=TRUE) %>%
  unnest("diets",keep_empty=TRUE) %>%
  unnest("occasions",keep_empty=TRUE)
head(keto_df)
## # A tibble: 6 × 38
##   vegetarian vegan glutenFree dairyFree veryHealthy cheap veryPopular sustainable lowFodmap weightWatcherSmartPoints
##   <lgl>      <lgl> <lgl>      <lgl>     <lgl>       <lgl> <lgl>       <lgl>       <lgl>                        <int>
## 1 TRUE       FALSE TRUE       FALSE     FALSE       FALSE TRUE        FALSE       FALSE                           19
## 2 TRUE       FALSE TRUE       FALSE     FALSE       FALSE TRUE        FALSE       FALSE                           19
## 3 TRUE       FALSE TRUE       FALSE     FALSE       FALSE TRUE        FALSE       FALSE                           19
## 4 TRUE       FALSE TRUE       FALSE     FALSE       FALSE TRUE        FALSE       FALSE                           19
## 5 TRUE       FALSE TRUE       FALSE     FALSE       FALSE TRUE        FALSE       FALSE                           19
## 6 TRUE       FALSE TRUE       FALSE     FALSE       FALSE TRUE        FALSE       FALSE                           19
## # ℹ 28 more variables: preparationMinutes <int>, cookingMinutes <int>, aggregateLikes <int>, healthScore <int>,
## #   pricePerServing <dbl>, id <int>, title <chr>, readyInMinutes <int>, servings <int>, cuisines <chr>,
## #   dishTypes <chr>, diets <chr>, occasions <chr>, author <chr>, nutrition_info <list<chr>>,
## #   nutrient_amount <list<dbl>>, nutrient_unit <list<chr>>, percentOfDailyNeeds <list<dbl>>,
## #   ingredient_id <list<int>>, ingredient_name <list<chr>>, ingredient_amount <list<dbl>>,
## #   ingredient_unit <list<chr>>, ingredient_nutrient <list<list>>, nutrition.caloricBreakdown.percentProtein <dbl>,
## #   nutrition.caloricBreakdown.percentFat <dbl>, nutrition.caloricBreakdown.percentCarbs <dbl>, …
For later use, I’ll also create a combined dataframe with an indicator function variable to indicate whether or not a diet came from the keto data frame. I’ll also make sure
vegan_df2 <-vegan_df
vegan_df2$keto <- rep(0,nrow(vegan_df))
keto_df2 <- keto_df
keto_df2$keto <- rep(1,nrow(keto_df))

combined_df <-rbind(vegan_df2,keto_df2)
head(combined_df)
## # A tibble: 6 × 39
##   vegetarian vegan glutenFree dairyFree veryHealthy cheap veryPopular sustainable lowFodmap weightWatcherSmartPoints
##   <lgl>      <lgl> <lgl>      <lgl>     <lgl>       <lgl> <lgl>       <lgl>       <lgl>                        <int>
## 1 TRUE       TRUE  TRUE       TRUE      TRUE        FALSE FALSE       FALSE       FALSE                           12
## 2 TRUE       TRUE  TRUE       TRUE      TRUE        FALSE FALSE       FALSE       FALSE                           12
## 3 TRUE       TRUE  TRUE       TRUE      TRUE        FALSE FALSE       FALSE       FALSE                           12
## 4 TRUE       TRUE  TRUE       TRUE      TRUE        FALSE FALSE       FALSE       FALSE                           12
## 5 TRUE       TRUE  TRUE       TRUE      TRUE        FALSE FALSE       FALSE       FALSE                           12
## 6 TRUE       TRUE  TRUE       TRUE      TRUE        FALSE FALSE       FALSE       FALSE                           12
## # ℹ 29 more variables: preparationMinutes <int>, cookingMinutes <int>, aggregateLikes <int>, healthScore <int>,
## #   pricePerServing <dbl>, id <int>, title <chr>, readyInMinutes <int>, servings <int>, cuisines <chr>,
## #   dishTypes <chr>, diets <chr>, occasions <chr>, author <chr>, nutrition_info <list<chr>>,
## #   nutrient_amount <list<dbl>>, nutrient_unit <list<chr>>, percentOfDailyNeeds <list<dbl>>,
## #   ingredient_id <list<int>>, ingredient_name <list<chr>>, ingredient_amount <list<dbl>>,
## #   ingredient_unit <list<chr>>, ingredient_nutrient <list<list>>, nutrition.caloricBreakdown.percentProtein <dbl>,
## #   nutrition.caloricBreakdown.percentFat <dbl>, nutrition.caloricBreakdown.percentCarbs <dbl>, …
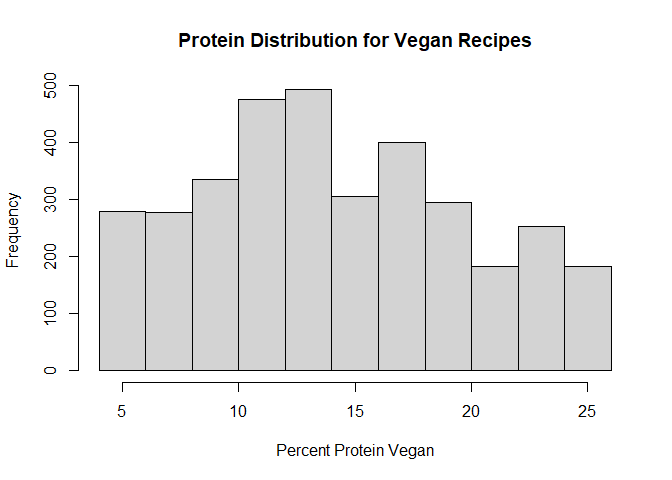
Suppose that we wanted to compare the protein percentage in the vegan recipes as compared to the keto recipes. Let’s take a look at the distributions.
h1 <- hist(vegan_df$nutrition.caloricBreakdown.percentProtein,
             main = "Protein Distribution for Vegan Recipes",
     xlab = "Percent Protein Vegan")
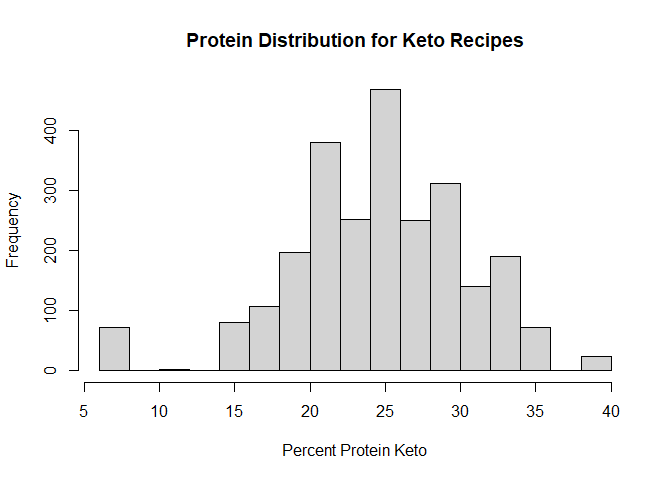
h2<-hist(keto_df$nutrition.caloricBreakdown.percentProtein,
         main = "Protein Distribution for Keto Recipes",
     xlab = "Percent Protein Keto")
plot( h1, col=rgb(0,0,1,1/4), xlim=c(0,50),main="",xlab="",ylab="")  # first histogram
plot( h2, col=rgb(1,0,0,1/4), xlim=c(0,50), add=T,main="",xlab="",ylab="")  # second
title(main = "Vegan vs. Keto Protein Distribution Comparison",
      xlab = "Diet Percent Protein: Vegan (Purple) and Keto (Pink)", ylab ="Frequency")
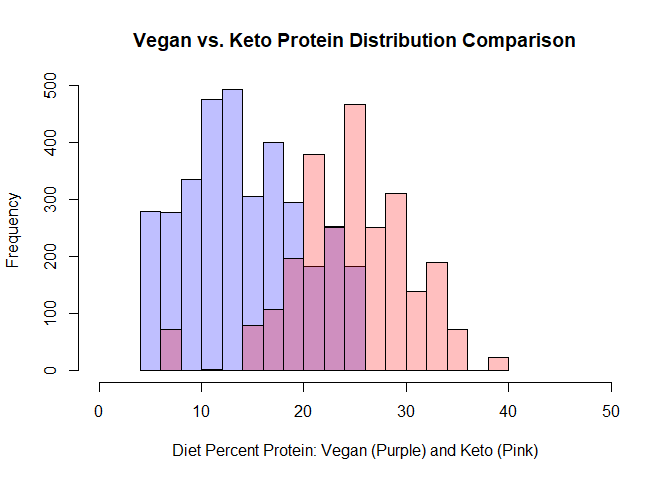
It’s fairly clear from this histograms (and especially that overlayed histogram), that it’s easier to get a higher percentage of your daily protein from the keto recipe. What about fats and carbs? Clearly by the name, a keto diet must necessarily be higher in fats than the vegan diet. I’m also guessing that there are more carbs in a vegan diet. Let’s use box plots to investigate.
boxplot(vegan_df$nutrition.caloricBreakdown.percentCarbs,keto_df$nutrition.caloricBreakdown.percentCarbs,names=c("Vegan","Keto"),col=c("Green","Yellow"))
title(main = "Vegan vs. Keto Carb Distribution Comparison",
      xlab = "Diet", ylab ="Percentage Carbs")
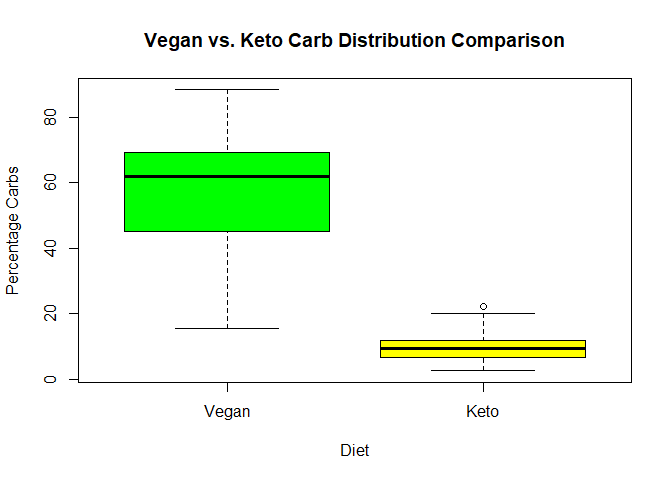 Unsurprisingly, it seems
that keto diets has less percentage of carbs as compared to vegan
recipes.
Unsurprisingly, it seems
that keto diets has less percentage of carbs as compared to vegan
recipes.
boxplot(vegan_df$nutrition.caloricBreakdown.percentFat,keto_df$nutrition.caloricBreakdown.percentFat,names=c("Vegan","Keto"),col=c("darkgreen","cornsilk"))
title(main = "Vegan vs. Keto Fat Distribution Comparison",
      xlab = "Diet", ylab ="Percentage Fats")
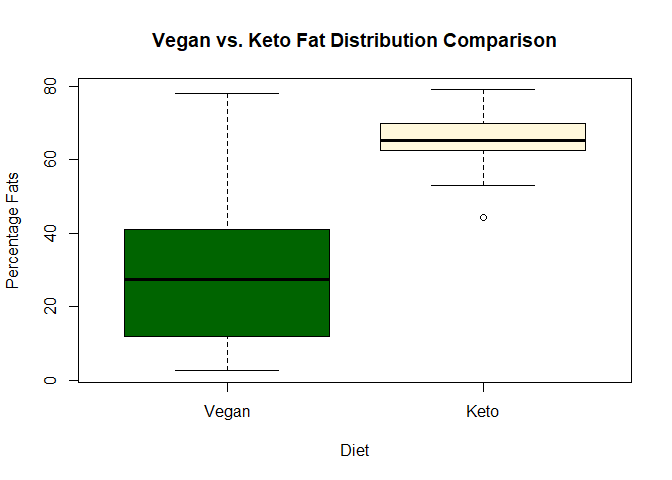
No surprises here! A ketogenic diet is intended to be high in fats, so the average percentage fats in a keto recipe is way higher than that of the vegan diet. Furthermore, there seems to be less spread so these diets are pretty homogeneously high-fat, it seems.
Do people seem to like the vegan or keto recipes more? Let’s compare the aggregate likes!
TotalLikes <- cbind(vegan_df$aggregateLikes,keto_df$aggregateLikes)
TotalLikes <- as.data.frame(TotalLikes) %>% rename("Vegan"= V1, "Keto" = V2)
barplot(colSums(TotalLikes),log="y",col=c("chartreuse2","coral"))
title(main = "Aggregate Like for Vegan vs. Keto Recipes",
      xlab = "Diet", ylab ="Aggregate Likes (Log Scale)")
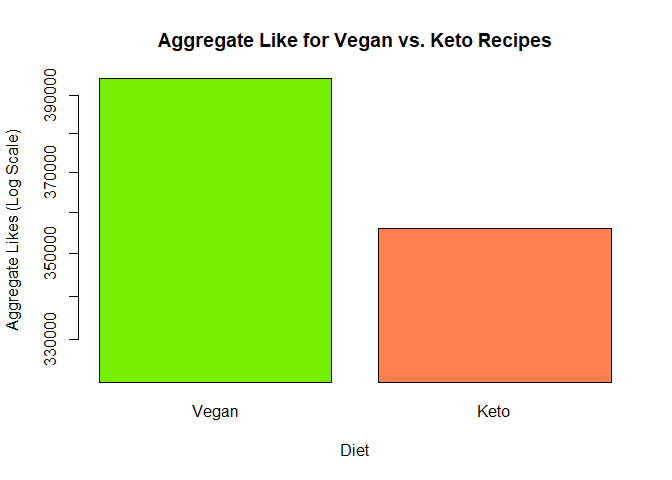
It seems that people like vegan recipes more than keto recipes! I wonder if it is because of anything in particular (does keto not gain a lot of traction? Do more people like vegan stuff?) Or perhaps, if it’s just that more carb-heavy recipes are liked? We could create a variable in combined_df that could classify whether something is high or low carb, and see how well-liked it is.
combined_df_carbs<- combined_df %>%
  mutate(carb_content = case_when(nutrition.caloricBreakdown.percentCarbs < 10 ~ 'Very Low',                nutrition.caloricBreakdown.percentCarbs < 26 ~ 'Low',
                           nutrition.caloricBreakdown.percentCarbs < 60 ~'Moderate',
                           nutrition.caloricBreakdown.percentCarbs >60 ~ 'High'
                           ))
combined_df_carbs$carb_content <- as.factor(combined_df_carbs$carb_content)
head(combined_df_carbs)
## # A tibble: 6 × 40
##   vegetarian vegan glutenFree dairyFree veryHealthy cheap veryPopular sustainable lowFodmap weightWatcherSmartPoints
##   <lgl>      <lgl> <lgl>      <lgl>     <lgl>       <lgl> <lgl>       <lgl>       <lgl>                        <int>
## 1 TRUE       TRUE  TRUE       TRUE      TRUE        FALSE FALSE       FALSE       FALSE                           12
## 2 TRUE       TRUE  TRUE       TRUE      TRUE        FALSE FALSE       FALSE       FALSE                           12
## 3 TRUE       TRUE  TRUE       TRUE      TRUE        FALSE FALSE       FALSE       FALSE                           12
## 4 TRUE       TRUE  TRUE       TRUE      TRUE        FALSE FALSE       FALSE       FALSE                           12
## 5 TRUE       TRUE  TRUE       TRUE      TRUE        FALSE FALSE       FALSE       FALSE                           12
## 6 TRUE       TRUE  TRUE       TRUE      TRUE        FALSE FALSE       FALSE       FALSE                           12
## # ℹ 30 more variables: preparationMinutes <int>, cookingMinutes <int>, aggregateLikes <int>, healthScore <int>,
## #   pricePerServing <dbl>, id <int>, title <chr>, readyInMinutes <int>, servings <int>, cuisines <chr>,
## #   dishTypes <chr>, diets <chr>, occasions <chr>, author <chr>, nutrition_info <list<chr>>,
## #   nutrient_amount <list<dbl>>, nutrient_unit <list<chr>>, percentOfDailyNeeds <list<dbl>>,
## #   ingredient_id <list<int>>, ingredient_name <list<chr>>, ingredient_amount <list<dbl>>,
## #   ingredient_unit <list<chr>>, ingredient_nutrient <list<list>>, nutrition.caloricBreakdown.percentProtein <dbl>,
## #   nutrition.caloricBreakdown.percentFat <dbl>, nutrition.caloricBreakdown.percentCarbs <dbl>, …
Make sure to group the carb content variable we just created.
carb_df <- combined_df_carbs %>%  group_by(carb_content)
head(carb_df)
## # A tibble: 6 × 40
## # Groups:   carb_content [1]
##   vegetarian vegan glutenFree dairyFree veryHealthy cheap veryPopular sustainable lowFodmap weightWatcherSmartPoints
##   <lgl>      <lgl> <lgl>      <lgl>     <lgl>       <lgl> <lgl>       <lgl>       <lgl>                        <int>
## 1 TRUE       TRUE  TRUE       TRUE      TRUE        FALSE FALSE       FALSE       FALSE                           12
## 2 TRUE       TRUE  TRUE       TRUE      TRUE        FALSE FALSE       FALSE       FALSE                           12
## 3 TRUE       TRUE  TRUE       TRUE      TRUE        FALSE FALSE       FALSE       FALSE                           12
## 4 TRUE       TRUE  TRUE       TRUE      TRUE        FALSE FALSE       FALSE       FALSE                           12
## 5 TRUE       TRUE  TRUE       TRUE      TRUE        FALSE FALSE       FALSE       FALSE                           12
## 6 TRUE       TRUE  TRUE       TRUE      TRUE        FALSE FALSE       FALSE       FALSE                           12
## # ℹ 30 more variables: preparationMinutes <int>, cookingMinutes <int>, aggregateLikes <int>, healthScore <int>,
## #   pricePerServing <dbl>, id <int>, title <chr>, readyInMinutes <int>, servings <int>, cuisines <chr>,
## #   dishTypes <chr>, diets <chr>, occasions <chr>, author <chr>, nutrition_info <list<chr>>,
## #   nutrient_amount <list<dbl>>, nutrient_unit <list<chr>>, percentOfDailyNeeds <list<dbl>>,
## #   ingredient_id <list<int>>, ingredient_name <list<chr>>, ingredient_amount <list<dbl>>,
## #   ingredient_unit <list<chr>>, ingredient_nutrient <list<list>>, nutrition.caloricBreakdown.percentProtein <dbl>,
## #   nutrition.caloricBreakdown.percentFat <dbl>, nutrition.caloricBreakdown.percentCarbs <dbl>, …
likes_sum <- combined_df_carbs %>%
  group_by(carb_content) %>%
  summarize(total_likes = sum(aggregateLikes))

# Create the barplot
ggplot(likes_sum, aes(carb_content, total_likes,fill=carb_content)) +
  geom_col() +
  xlab("Carb Content") +
  ylab("Total Likes") +
  ggtitle("Total Likes by Carb Content")
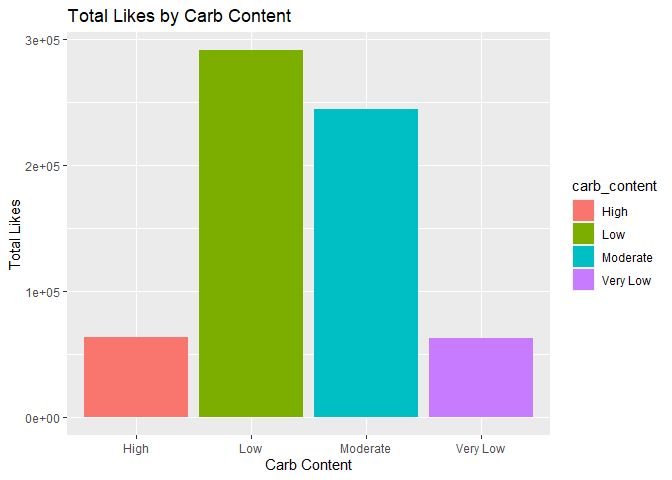
It seems that both high and very low carb recipes are not that well-liked! Furthermore, it seems that low carb recipes are the best liked, followed by moderate carb recipes.
Let’s get a numerical summary for this to investigate further:
#getting summary statistics for each of the categories
likesSummary <- combined_df_carbs %>%
  group_by(carb_content) %>%
   summarize("Min." = min(aggregateLikes),
            "1st Quartile" = quantile(aggregateLikes, 0.25, na.rm=TRUE),
            "Median" = quantile(aggregateLikes, 0.5, na.rm=TRUE),
            "Mean" = mean(aggregateLikes, na.rm=TRUE),
            "3rd Quartile" = quantile(aggregateLikes, 0.75, na.rm=TRUE),
            "Max" = max(aggregateLikes),
            "Std. Dev." = sd(aggregateLikes, na.rm=TRUE)
            )
knitr::kable(likesSummary,
             caption="Summary Statistics for Aggregate Likes by Carb Content Classification ",
             digits=2)
| carb_content | Min. | 1st Quartile | Median | Mean | 3rd Quartile | Max | Std. Dev. |
|---|---|---|---|---|---|---|---|
| High | 1 | 1 | 2 | 35.65 | 11 | 471 | 100.56 |
| Low | 0 | 1 | 2 | 208.62 | 11 | 5518 | 907.18 |
| Moderate | 0 | 1 | 4 | 164.00 | 11 | 3689 | 698.91 |
| Very Low | 0 | 1 | 1 | 45.35 | 7 | 991 | 163.40 |
Summary Statistics for Aggregate Likes by Carb Content Classification
Indeed, there is a difference in distributions for each of the carb content categories. The mean # of likes is highest for the low carb recipes. However, there also appears to be more variation for the distribution of likes for the low carb recipes!
What about the relationship for these recipes between the macro-nutrient? Is there some sort of pattern? We’ll explore the relationships between carbs and fat, carbs and protein, as well as protein and fat. I’ll also do a breakdown for these relationships for each of the diets.
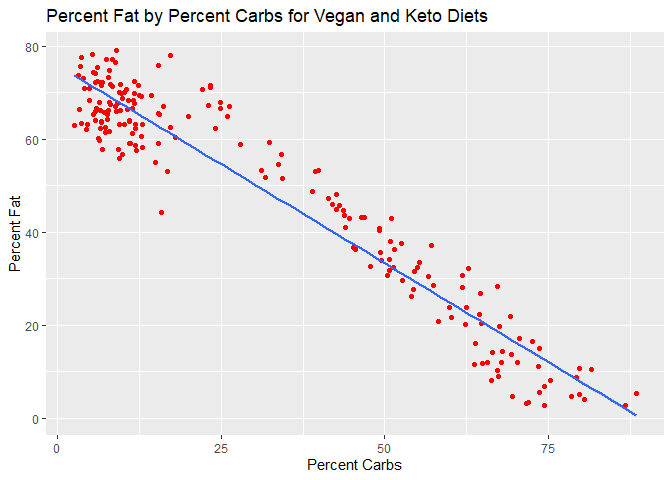
#Carbs vs Fat, all
ggplot(combined_df, aes(x=nutrition.caloricBreakdown.percentCarbs, y=nutrition.caloricBreakdown.percentFat)) +
  geom_point(col="red")+
  geom_smooth(method=lm) +
  xlab("Percent Carbs") +
  ylab("Percent Fat") +
  ggtitle("Percent Fat by Percent Carbs for Vegan and Keto Diets")
## `geom_smooth()` using formula = 'y ~ x'
#Carbs vs Protein, all
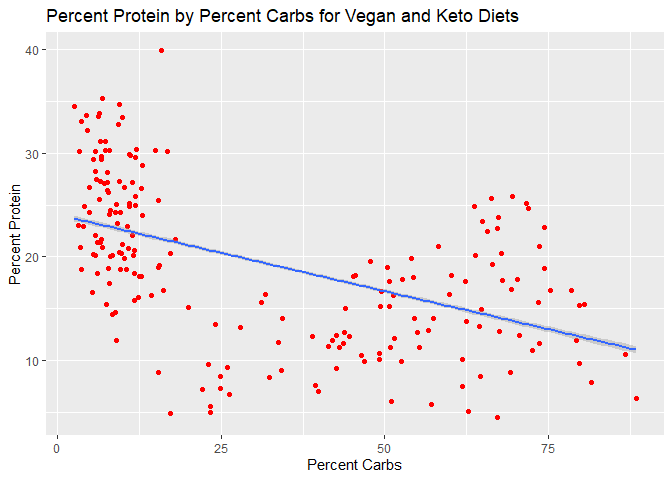
ggplot(combined_df, aes(x=nutrition.caloricBreakdown.percentCarbs, y=nutrition.caloricBreakdown.percentProtein)) +
geom_point(col="red")+
geom_smooth(method=lm) +
xlab("Percent Carbs") +
ylab("Percent Protein") +
ggtitle("Percent Protein by Percent Carbs for Vegan and Keto Diets")
## `geom_smooth()` using formula = 'y ~ x'
ggplot(combined_df, aes(x=nutrition.caloricBreakdown.percentProtein, y=nutrition.caloricBreakdown.percentFat)) +
   geom_point(col="red")+
  geom_smooth(method=lm) +
  xlab("Percent Protein") +
  ylab("Percent Fat") +
  ggtitle("Percent Fat by Percent Protein for Vegan and Keto Diets")
## `geom_smooth()` using formula = 'y ~ x'
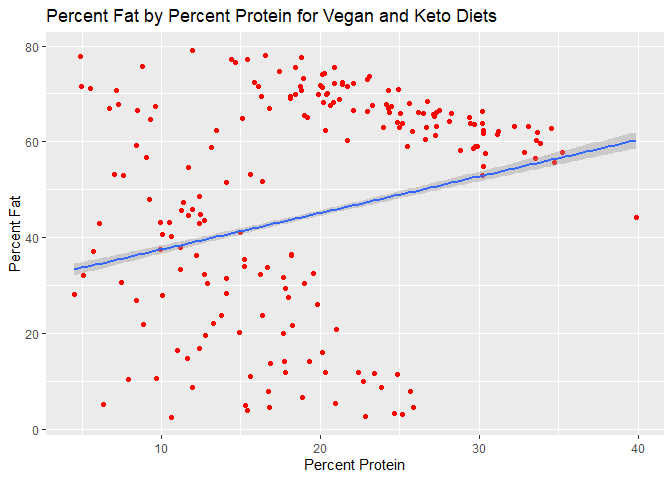
There seems to be a positive linear relationship between percent protein and percent fat, but curiously there looks like there is a strongly negative relationship between carbs and fat.
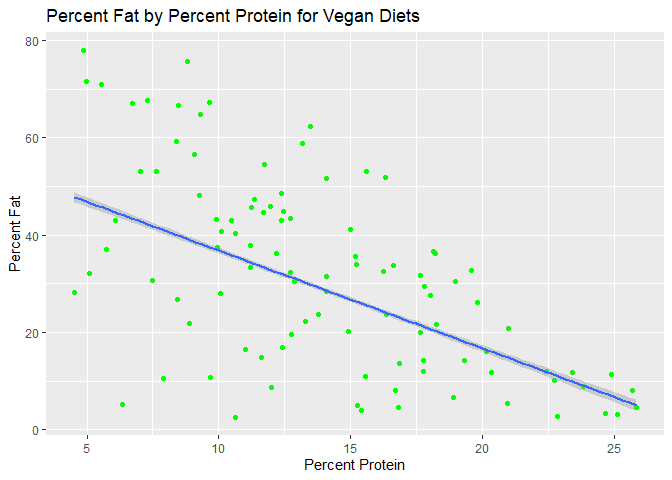
Let’s break it down by the specific diets:
#vegan, carbs vs. fat
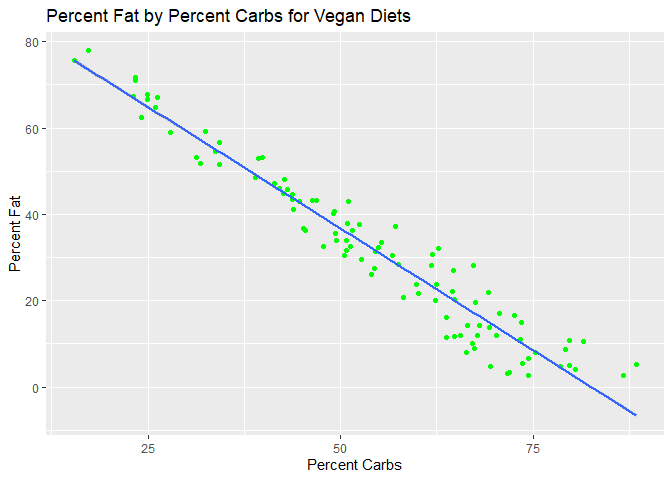
ggplot(vegan_df, aes(x=nutrition.caloricBreakdown.percentCarbs, y=nutrition.caloricBreakdown.percentFat)) +
geom_point(col="green")+
geom_smooth(method=lm) +
xlab("Percent Carbs") +
ylab("Percent Fat") +
ggtitle("Percent Fat by Percent Carbs for Vegan Diets")
## `geom_smooth()` using formula = 'y ~ x'
#vegan, carbs vs. protein
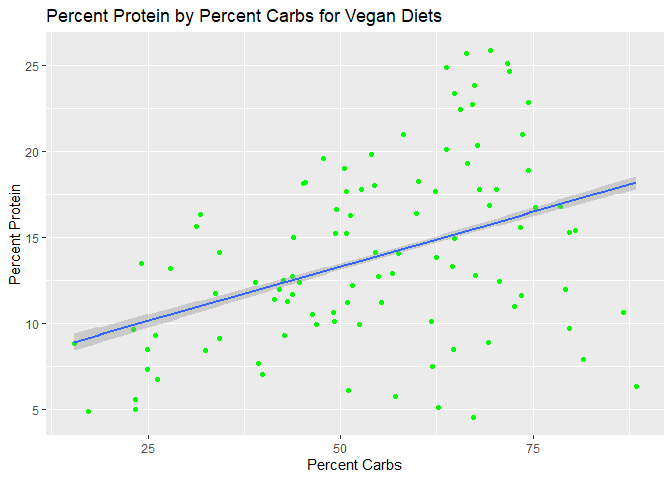
ggplot(vegan_df, aes(x=nutrition.caloricBreakdown.percentCarbs, y=nutrition.caloricBreakdown.percentProtein)) +
geom_point(col="green")+
geom_smooth(method=lm) +
xlab("Percent Carbs") +
ylab("Percent Protein") +
ggtitle("Percent Protein by Percent Carbs for Vegan Diets")
## `geom_smooth()` using formula = 'y ~ x'
#vegan, protein vs. fat
ggplot(vegan_df, aes(x=nutrition.caloricBreakdown.percentProtein, y=nutrition.caloricBreakdown.percentFat)) +
  geom_point(col="green")+
  geom_smooth(method=lm) +
  xlab("Percent Protein") +
  ylab("Percent Fat") +
  ggtitle("Percent Fat by Percent Protein for Vegan Diets")
## `geom_smooth()` using formula = 'y ~ x'
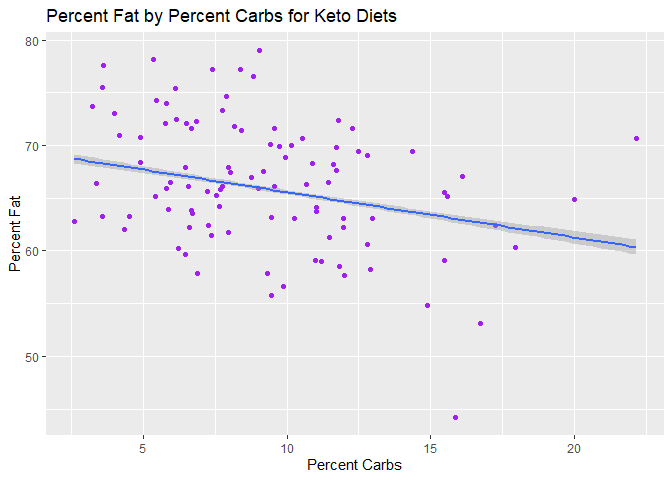
#keto, carbs vs. fat
ggplot(keto_df, aes(x=nutrition.caloricBreakdown.percentCarbs, y=nutrition.caloricBreakdown.percentFat)) +
  geom_point(col="purple")+
  geom_smooth(method=lm) +
  xlab("Percent Carbs") +
  ylab("Percent Fat") +
  ggtitle("Percent Fat by Percent Carbs for Keto Diets")
## `geom_smooth()` using formula = 'y ~ x'
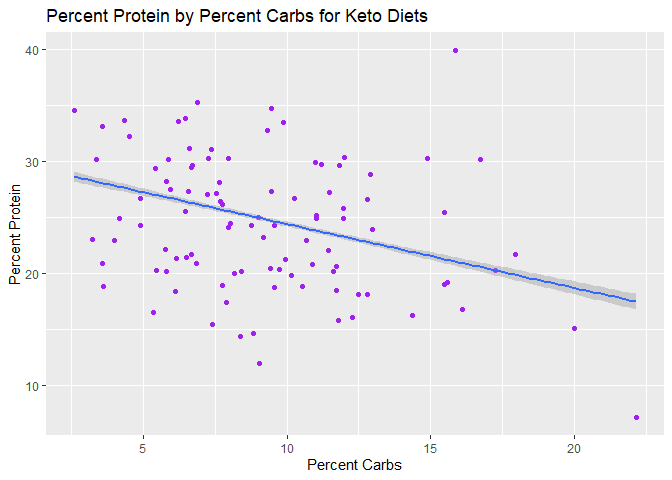
#keto, carbs vs. protein
ggplot(keto_df, aes(x=nutrition.caloricBreakdown.percentCarbs, y=nutrition.caloricBreakdown.percentProtein)) +
  geom_point(col="purple")+
  geom_smooth(method=lm) +
  xlab("Percent Carbs") +
  ylab("Percent Protein") +
  ggtitle("Percent Protein by Percent Carbs for Keto Diets")
## `geom_smooth()` using formula = 'y ~ x'
#keto, protein vs. fat
ggplot(keto_df, aes(x=nutrition.caloricBreakdown.percentProtein, y=nutrition.caloricBreakdown.percentFat)) +
  geom_point(col="purple")+
  geom_smooth(method=lm) +
  xlab("Percent Protein") +
  ylab("Percent Fat") +
  ggtitle("Percent Fat by Percent Protein for Keto Diets")
## `geom_smooth()` using formula = 'y ~ x'
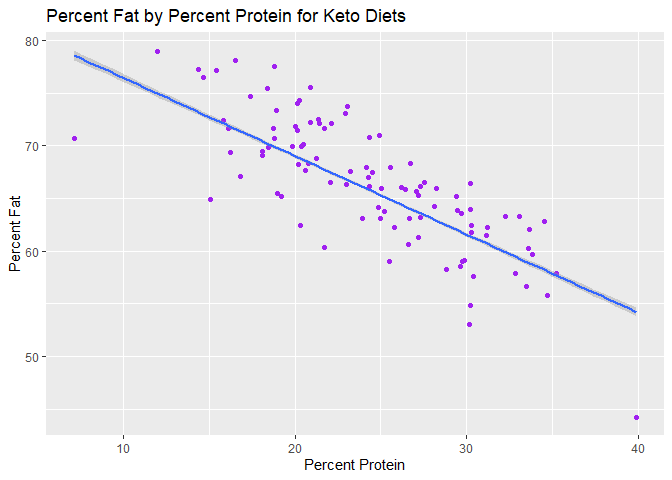 Curiously, it seems that
there is a strongly negative relationship between fat and protein for
both keto and vegan diets (as you gain more protein, you get less fat).
This isn’t the case for the combination of all the diets! I was
especially surprised for keto, as you would think that your protein
percentage and fat percentage would both be relatively high if you’re
keeping starches (carbs) low. I also can’t really explain why the
relationship between protein and fat would be negative for the vegan or
keto diets, but combined the relationship is semi-positive.
Curiously, it seems that
there is a strongly negative relationship between fat and protein for
both keto and vegan diets (as you gain more protein, you get less fat).
This isn’t the case for the combination of all the diets! I was
especially surprised for keto, as you would think that your protein
percentage and fat percentage would both be relatively high if you’re
keeping starches (carbs) low. I also can’t really explain why the
relationship between protein and fat would be negative for the vegan or
keto diets, but combined the relationship is semi-positive.
We also have a lot of interesting categorical variables (especially logicals) that we could look at. Let’s look at some contingency tables for each of the diets. Let’s start by looking at the contingency table between a recipe being very healtlhy and being gluten-free.
vegan_health_tab<-table(vegan_df$glutenFree,vegan_df$veryHealthy)
colnames(vegan_health_tab)=c("Not Very Healthy","Very Healthy")
rownames(vegan_health_tab)=c("Not Gluten Free","Gluten Free")
kable(vegan_health_tab)
| Not Very Healthy | Very Healthy | |
|---|---|---|
| Not Gluten Free | 39 | 393 |
| Gluten Free | 336 | 2717 |
keto_health_tab<-table(keto_df$glutenFree,keto_df$veryHealthy)
colnames(keto_health_tab)=c("Not Very Healthy","Very Healthy")
rownames(keto_health_tab)=c("Not Gluten Free","Gluten Free")
kable(keto_health_tab)
| Not Very Healthy | Very Healthy | |
|---|---|---|
| Not Gluten Free | 52 | 0 |
| Gluten Free | 1967 | 530 |
I’m a little surprised that we pulled no recipes that were NOT gluten free and very healthy for the keto diet!
What about in general?
combined_health_tab<-table(combined_df$glutenFree,combined_df$veryHealthy)
colnames(combined_health_tab)=c("Not Very Healthy","Very Healthy")
rownames(combined_health_tab)=c("Not Gluten Free","Gluten Free")
kable(combined_health_tab)
| Not Very Healthy | Very Healthy | |
|---|---|---|
| Not Gluten Free | 91 | 393 |
| Gluten Free | 2303 | 3247 |
It seems in aggregate, there is some sort of relationship between a recipe being very healthy and being gluten-free.
What about recipes being popular and cheap?
combined_price_tab<-table(as.factor(combined_df$veryPopular),as.factor(combined_df$cheap))
colnames(combined_price_tab)=c("Not Cheap")
rownames(combined_price_tab)=c("Not Very Popular","Very Popular")
kable(combined_price_tab)
| Not Cheap | |
|---|---|
| Not Very Popular | 5699 |
| Very Popular | 335 |
Surprisingly, it seems that we weren’t able to pull in any cheap recipes at all! This might just be a peculiarity of the websites themselves and the most recent recipes.
Let’s try our other function, out of curiosity to see what kind of data we pull. Does this API pull relevant data? Suppose that I’m a user looking for bread. I’m also interested in a high carb diet. However, I’m also gluten-free.
apiKey <- "987c314948d14831ac64f7edaa24a25c"
query <- "bread"
carbs <- 60
fats <- 20
protein <- 20
intolerances <- c("gluten")

bread_ingredient_df <- getIngredientsByQuery(apiKey, query, carbs, fats, protein, intolerances)

print(bread_ingredient_df)
##          id                      name              image
## 1      9059                breadfruit     breadfruit.jpg
## 2     18372               baking soda   white-powder.jpg
## 3  10118375             instant yeast yeast-granules.jpg
## 4     18216                crispbread     crispbread.png
## 5     18019              banana bread    quick-bread.png
## 6     93671          banana bread mix   banana-bread.jpg
## 7   1052035         gingerbread spice   garam-masala.jpg
## 8  10099050         gluten free bread    white-bread.jpg
## 9     93694   gluten free breadcrumbs    breadcrumbs.jpg
## 10    99049 gluten free cornbread mix      cornbread.jpg
Of 10 rows, I received about 5 (breadcrumbs, bread, banana bread, banana bread mix, and instant yeast) if we’re interpreting this generously. It seems that you have to be careful with how you query, since this returns things that are kind of tangentially related about half the time here.
Conclusion
In summary, I built functions to interact with a couple of of spoonacular’s API’s endpoints. I retrieved some of the data, manipulated it, and explored it visually as well as with numerical summaries and tables. Some of my findings were nothing to call home about,since we knew that vegan recipes would probably be more carb-y and less protein-y than a keto diet.However, I was surprised by some things such as keto recipes having an inverse relationship between percent protein and percent carbs whereas it didn’t appear to be the case for the aggregated data. I also demonstrated the limits of some of the APIs themselves, and how they can return things very broadly.
Finally, I hope this helps with understanding how to interact with and utilize APIs! Happy coding!